Does NM have a drop-out problem?
Yes.
Is the drop-out problem most pronounced in grades 9 – 12?
Yes.
Is the drop-out problem limited to the upper grades?
No.
This analysis uses enrollment data published by the NM Public Education Department on its website. Findings are based on 2010 student cohorts for years 2010 – 2013.
- Enrollment for 1st grade students in 2010 was tracked for 3 years as they entered 2nd grade and then 3rd grade.
- Enrollment for 2nd grade students in 2010 was tracked as they entered 3rd grade and then 4th grade.
- Enrollment for 3rd grade students in 2010 was tracked as they entered 4th grade and then 5th grade.
- Etc.
Enrollment by Cohort over 3 Years
The following chart shows 3-year enrollment data for each cohort (click image for larger view).
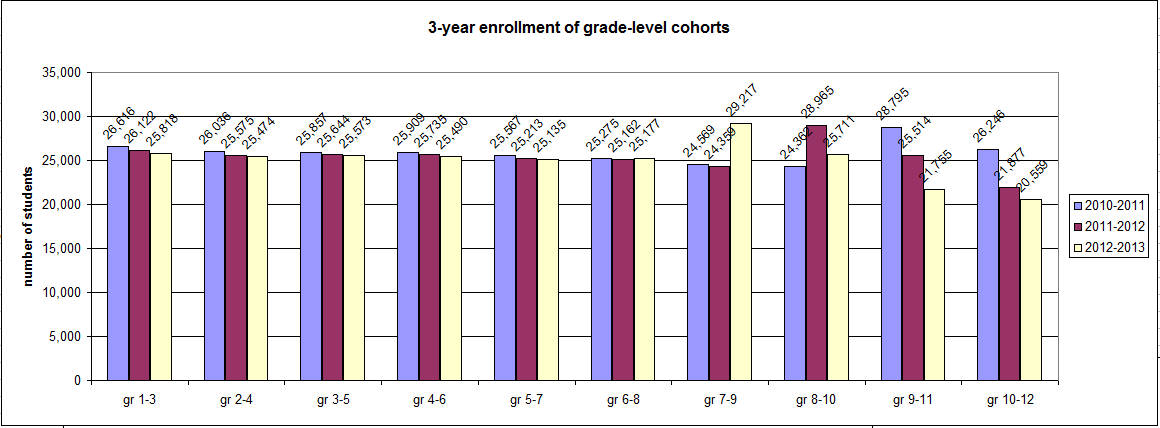
Help understanding the figure: In this figure, the first grouping is the cohort of students in 1st grade in 2010, showing their enrollment in 1st grade, 2nd grade, and 3rd grade. The second grouping is the cohort of students in 2nd grade in 2010, showing their enrollment in 2nd grade, 3rd grade, and 4th grade, etc.
Every cohort experienced a decrease in enrollment from the first to third year, except in one case. 9th-grade enrollment increased for every cohort before declining again. This may be the result of students entering public school for the first time, such as after home schooling or private elementary / middle schools.
The following figure shows not only the total grade-level enrollment for the three years under study combined but also the spike in 9th grade enrollment.
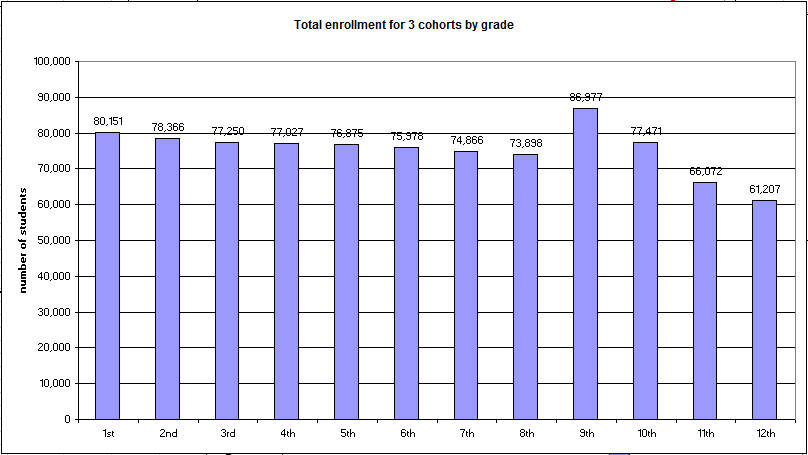
Total enrollment for 3 cohorts by grade level
Total enrollment also experienced the greatest decreases in the secondary grades (here defined as grades 9, 10, 11, and 12), representing the highest number of student drop-outs.
Help understanding the figure: 1st grade represents the 1st grade enrollment in 2010-2011 school year plus 1st grade enrollment in 2011-2012 plus 1st grade enrollment in 2012-2013.
Decreases in enrollment by cohort over 3 years
Enrollment is defined as the number of students in school in a given year. Changes in enrollment indicate new enrollments minus student drop-outs. Positive changes, i.e., increased enrollment, means more students enrolled than dropped out, and negative changes, i.e., decreased enrollment, means more students dropped out than enrolled. The actual number of student drop-outs or enrollments may be greater than the absolute value of the change in enrollment. (For example, let’s say the enrollment changes from 1,000 to 900 over 3 years. That’s a change of -100, or an absolute value of 100. During that time, 50 new students entered the school system and 150 students dropped out. Total change = 50 enrollments – 150 dropouts = -100. This gives a net decrease in student enrollment of 100, even though the number of student drop-outs was higher than 100. Similarly, any increase in total enrollment means the number of new enrollments is greater than the number of drop-outs, although drop-outs may still be occurring.)
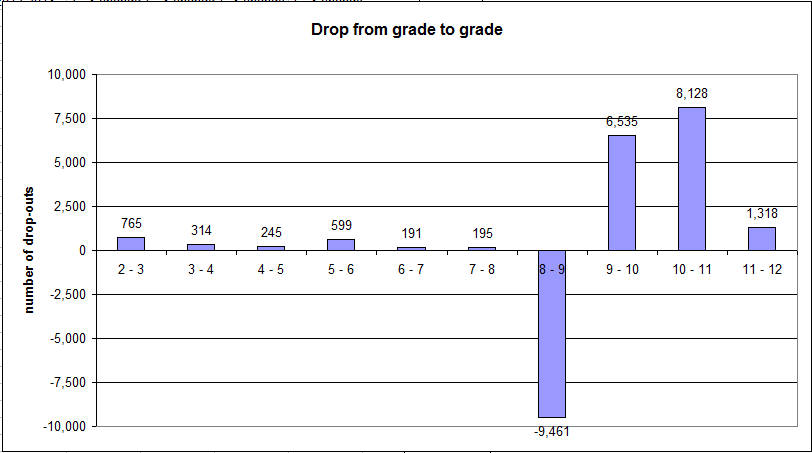
Enrollment data in grades 1 – 12 for years 2010 – 2013 show three peaks in decreased enrollment: grade 3, grade 6, and grades 9 – 11. The number of dropouts for each cohort over three years shows that students drop out in large numbers in the lowest grades, with a minor increase in drop-outs in upper lower middle school, and a major increase in early secondary years. The following figure demonstrates these peaks. Positive numbers represent the number of students by which enrollment decreases over three years (enrollment in the first year minus the enrollment in the third year).

Drop-outs per 3-year cohorts
Help understanding the figure: The first bar represents enrollment data for the 2010 1st grade cohort, showing how many FEWER students the cohort had in 2012-2013 school year than in the 2010-2011 school year. The second bar represents the same difference for the 2010 2nd grade cohort. Etc.
Notice that the grade 7-9 cohort experienced a negative decrease in enrollment, i.e., an increase in enrollment, of 4,648 students, meaning that the cohort of students in 7th grade in 2010 had 4,648 MORE students when they were in 9th grade. The increase in 9th grade enrollment also increased enrollment for the grade 8 – 10 cohort, but the increase is much smaller due to the high number of drop-outs from grade 9 to 10, as will be demonstrated next.
Changes in enrollment between grades
Changes in total enrollment from one grade level to the next pinpoints when students are dropping out. Analysis that combines 2 cohorts’ changes in enrollment between grades helps to mitigate any cohort-specific factors. Thus, this analysis shows the degree of change for one cohort between two grades plus the degree of change for a second cohort between the same two grades. The resulting changes in total enrollment between grades are as follows.
Total change in enrollment between grade levels
Given that only 3 years of data are available, and because this analysis tracks student cohorts beginning in 1st grade, the change from grade 1 to 2 is not possible to identify. Only one cohort beginning in 2010 made that grade-level transition. However, by contrast, 2 cohorts made the grade 2 to grade 3 transition, and all subsequent transitions. (For example, the 2nd grade students in 2010 transitioned from 2nd to 3rd grade in 2011, and the first grade students in 2010 transitioned from 2nd to 3rd grade in 2012.)
Help understanding this figure: The bars represent the number of fewer students, so any bar above 0 is a decrease in enrollment, and any number below 0 is a negative decrease, i.e., increase, in enrollment. For example, this figure indicates that total enrollment in third grade for 2 cohorts was lower by 765 students than total enrollment in 2nd grade; enrollment decreased by 765 students.
This graph indicates the following changes in enrollment:
- Enrollment decreases peaked as students entered 3rd grade
- Enrollment decreases peaked again as students entered 6th grade
- Enrollment increased greatly as students entered 9th grade
- Enrollment decreases greatly peaked as students entered 10th grade
- Enrollment decreases were even greater as students entered 11th grade
- Enrollment decreases were less as students entered 12th grade.
Surprises
The high degree of enrollment changes in upper grades is not surprising. Many students enter the school system in the 9th grade, such as from home school environments. Furthermore, the high drop-out rate following 9th grade is well established.
The one surprise is the greater decrease in enrollment from 2nd to 3rd grade, approximately 1.5% decrease in enrollment. Although not at the same degree as seen in the secondary grades, the change is greater than any other years, from grades 3 to 9.
What is happening that causes so many students to drop out after second grade? Are parents pulling their children out of school because they don’t think the schools are preparing their children to read on grade level in the third grade? Are parents transferring their children to private / parochial / or home schools? Where are students going and what are the long-term effects of early drop-out? Presuming they enter educational environments somewhere, are they more likely to drop out again later?
The Three Rivers Education Foundation would like to study this issue, given the availability of funding to conduct the study. Much research has been, and is being, conducted on the 9th to 10th grade drop-out problem, but the drop-out problem occurring in the lower grades has received little attention.